Continuing our series about LDO PSRR, check out our previous blog for a recap - What is PSRR? - Part III as in Part IV we will continue to explain LDO´s behavior and its interesting parameters. In the current article, we will focus on power supply rejection ratio (PSRR) from a real-world perspective. It can help to connect the datasheet numbers with scope measurements.
First of all, it has to be said that in every electronic system (even with linear regulators only) where multiple load points are presented the output voltage ripple can occur and could affect other parts. So let´s explain PSRR in real scope measurements.
When PSRR is shown on a datasheet, it’s measured as the ratio between voltage ripple at the input and the output. The measurement itself is relatively simple if a few rules are kept in mind. The low-dropout (LDO) regulator should be powered from a clean DC source with coupled sine waves ripple voltage. Output load should be strictly resistive to prevent interaction between the electronic load and LDO regulator. Ripple voltage amplitude must be chosen carefully to keep the LDO in regulation and with enough voltage headroom. For example, the amplitude of the AC signal cannot be 300 mV when VIN=3.6 V and VOUT=3.3 V because the LDO would be in dropout and just pass the input ripple to the output.
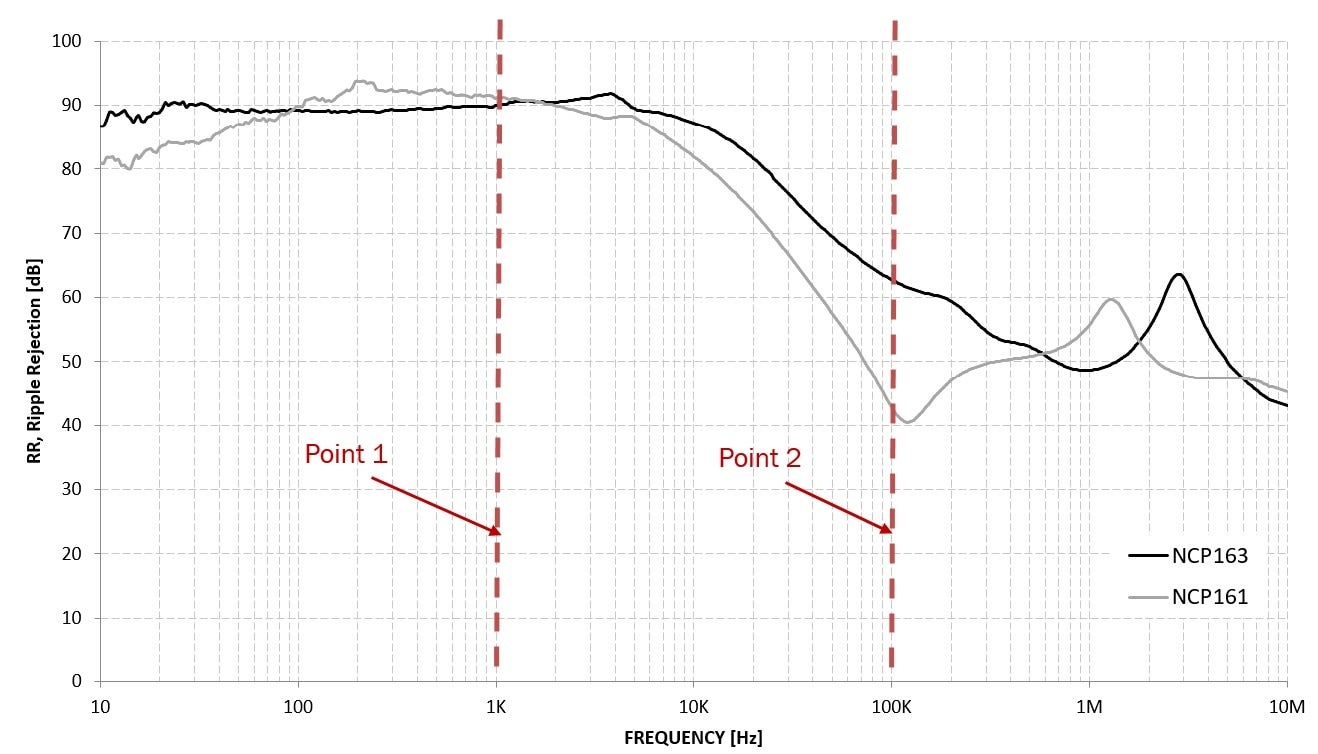
For example, in Figure 1 see the PSRR chart for ON Semiconductor LDOs NCP163 and NCP161. Similar charts are widely used in many LDO datasheets throughout the semiconductor industry. This real-world example shows PSRR over a frequency range of up to 10 MHz. For our case study, we marked two points which are shown in the time domain on the next pictures – 1 kHz and 100 kHz. The 1 kHz is the most common frequency for PSRR specification in the datasheet electrical characteristic table and 100 kHz is an area where many DC-DC converters work.
Figure 1. PSRR chart for NCP163 and NCP161 device
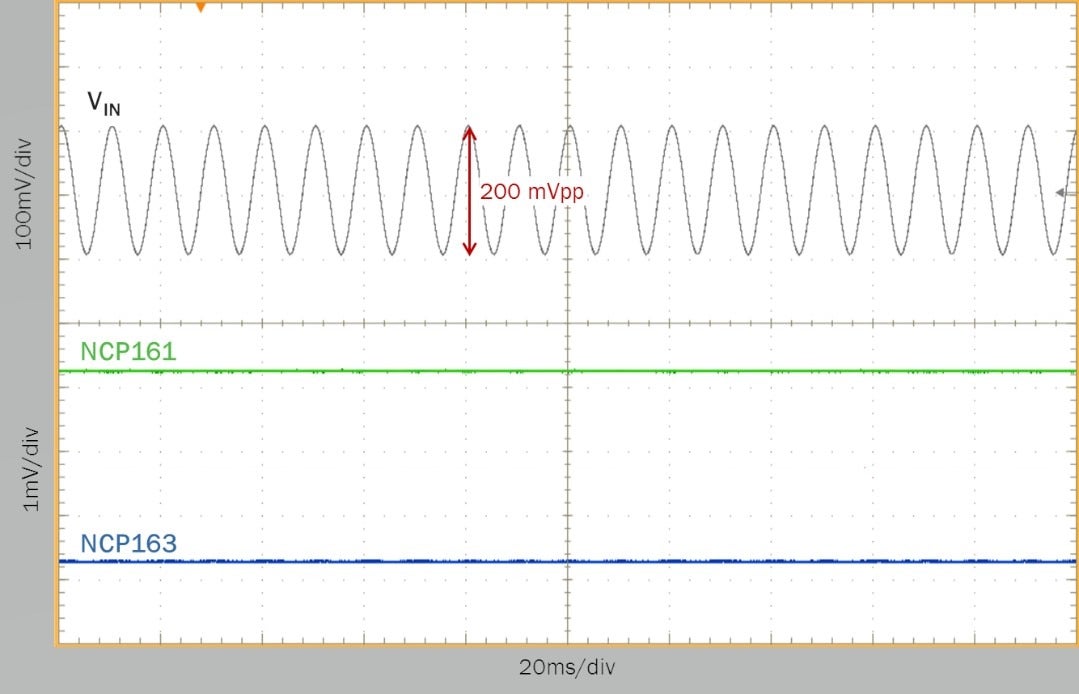
At point 1, the PSRR is about 90 dB which means input ripple is attenuated approximately 32,000 times. The picture below was captured for an input voltage ripple of 200 mVpp, meaning that ripple on the LDO output is only about 6 uVand there is no chance of seeing it on the scope. As demonstrated in Figure 2 - a straight line. Figure 1. PSRR chart for NCP163 and NCP161 device
Figure 2. Scope figure for 1 kHz – PSRR about 90 dB for both devices
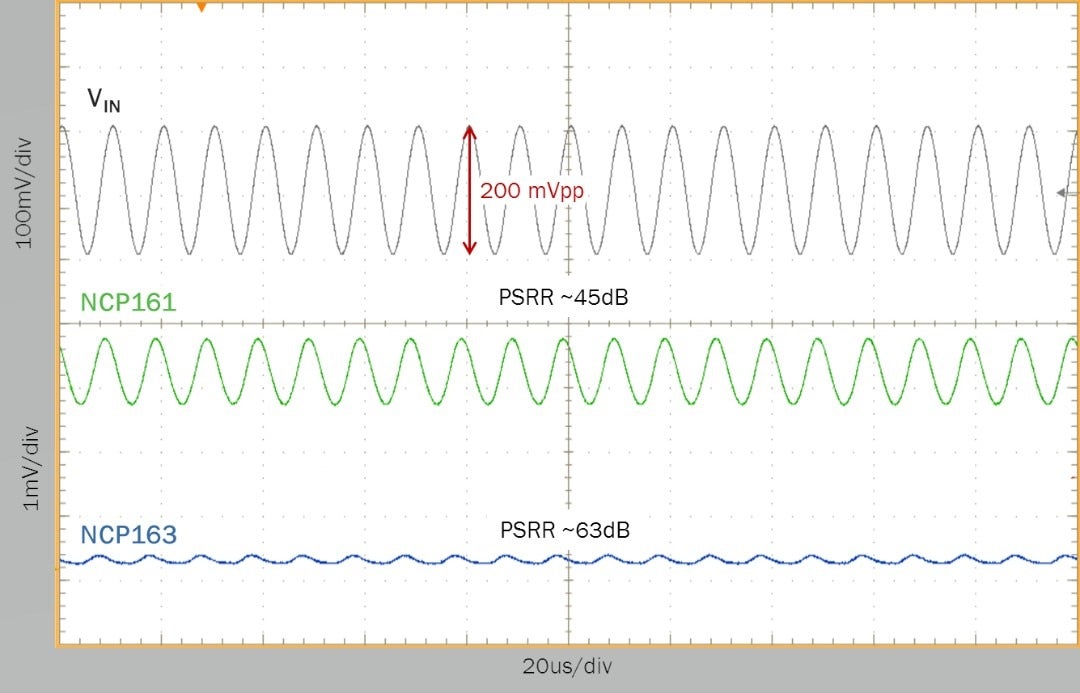
The situation in Figure 3 shows what happens at 100 kHz frequency. We know from Figure 1 that PSRR is much lower than 90 dB for both devices and that there’s a significant difference between them. Taking a closer look at the time domain, take for example that the application requires an input voltage ripple below 1 mVpp. The NCP161 is borderline while the NCP163 meets the requirement with a large margin, peak to peak the ripple is below 200 uVpp.
Figure 3. Scope figure for 100 kHz – PSRR is much different
As seen in Figures 1-3, the PSRR parameter as a single number in the electrical table is not sufficient to decide the suitability in designed applications. System engineers must take into account input voltage ripple frequency and check PSRR charts at their required point. The modern DC-DC converters switching in the MHz range and the LDO should be carefully matched to provide optimal performance. Most LDO datasheets specify PSRR at just 1 kHz and promote high values for good performance, but they may not be good enough as a DC-DC post-regulator due to the poor performance in higher frequency ranges. For that reason, it is very important to consider application conditions and then select an appropriate LDO. ON Semiconductor is providing similar charts like figure 1 in all our datasheets so customers can find the necessary information to complete their design.
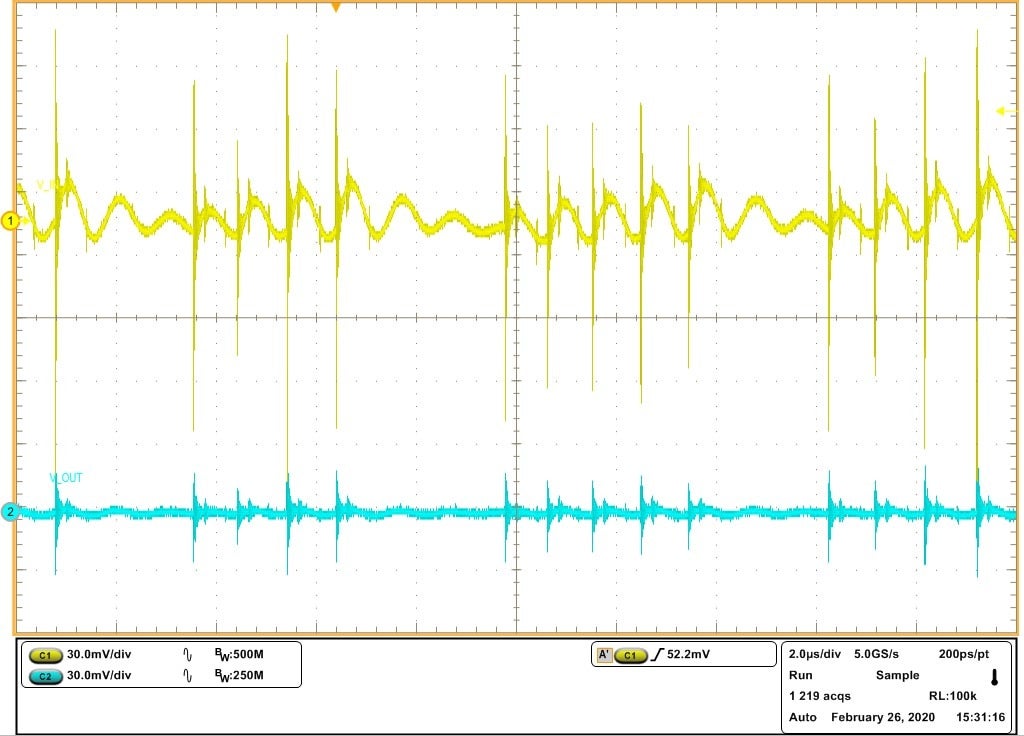
Finally, let´s see how the combination of a DC-DC converter and LDO perform together in a system solution. The FAN2356 is chosen as the DC-DC converter. It has an efficiency of up to 96% and an adjustable switching frequency up to 1.5 MHz. In our example, the switching frequency is set to 500 kHz. The post regulator LDO is NCP163 which is a high PSRR LDO with ultra-low noise output. The DC-DC converter output voltage is 3.6 V and LDO output is 3.3 V. Based on this the voltage headroom is 300 mV and LDO load current is 250 mA. In Figure 4, we can see the DC-DC output voltage on the yellow trace and the LDO output voltage on the blue trace. The vertical scale is set to 30 mV/div for both traces to easily compare the LDO impact.
Figure 4. DC-DC converter with LDO post regulator
We can clearly see large spikes and ripple voltage on the DC-DC output which can cause issues for power-sensitive devices. The LDO output is more clear and stable. The ripple is reduced down to the mV range and spikes are suppressed to ~30-40 mV. With this performance, the output voltage can be used to power a wide spectrum of power-sensitive applications.
Be sure to subscribe to our blog to continue getting updates from our team of experts as well as staying up to date on our latest technologies and solutions in our various market segments.
Follow us on social media!
Twitter | Facebook | LinkedIn | Instagram | YouTube


